
Introduction:
The interquartile range (IQR) is a measure of variability in a dataset that is used in data analysis. It is a measure of the range of the middle 50% of the dataset and is less sensitive to outliers than other measures of variability, such as the range. Calculating the IQR by using IQR Calculator involves several steps, which are outlined below.
Step 1: Arrange the data
The first step in calculating the IQR is to arrange the data in order from smallest to largest. This can be done manually or with the help of software or a calculator.
Step 2: Find the median
Once the data is arranged, the next step is to find the median, which is the middle value in the dataset. If the dataset contains an odd number of values, the median is the middle value. If the dataset contains an even number of values, the median is the average of the two middle values.
Step 3: Divide the data into two halves
After finding the median, the next step is to divide the data into two halves. If the dataset contains an odd number of values, the median value is not included in either half. If the dataset contains an even number of values, the median value is included in both halves.

The next steps in calculating the IQR involve finding the quartiles, which are the values that divide the dataset into quarters. These steps are covered in the next section.
Step 4: Find the median of the lower half (Q1)
After dividing the data into two halves, the next step is to find the median of the lower half, which is also known as the first quartile (Q1). This is the value that is greater than or equal to 25% of the values in the dataset and less than or equal to 75% of the values in the dataset.
Step 5: Find the median of the upper half (Q3)
The next step is to find the median of the upper half, which is also known as the third quartile (Q3). This is the value that is greater than or equal to 75% of the values in the dataset and less than or equal to 25% of the values in the dataset.
Step 6: Calculate the IQR
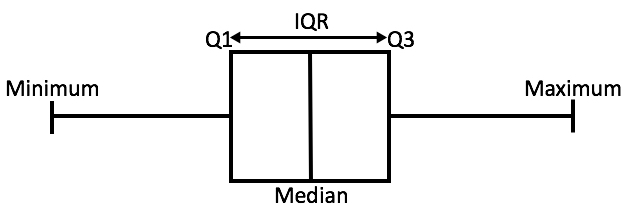
The final step in calculating the IQR is to subtract the value of Q1 from the value of Q3. This gives us the range of the middle 50% of the dataset. Mathematically, we can express the IQR as:
IQR = Q3 – Q1
Interpretation of IQR results:
The IQR provides information about the spread of the middle 50% of the dataset. A larger IQR indicates that the data is more spread out, while a smaller IQR indicates that the data is less spread out. The IQR is also used to identify outliers, which are data points that are significantly different from the rest of the dataset.
Uses of IQR:
The IQR is commonly used in data analysis to compare the variability of two or more datasets. It is also used to identify outliers and to determine the range of values that are typical for a particular dataset.
Advantages of using IQR:
The IQR is less sensitive to outliers than other measures of variability, such as the range. This makes it a more robust measure of variability for datasets that contain outliers.
Conclusion:
The IQR is a useful measure of variability that provides information about the spread of the middle 50% of a dataset. It is easy to calculate and is less sensitive to outliers than other measures of variability.
Appendices
FAQ’s
What is the difference between range and IQR?
Range is a measure of the spread of data and is calculated as the difference between the highest and lowest values in a dataset. IQR, on the other hand, measures the spread of the middle 50% of the data and is less affected by outliers. It is calculated as the difference between the third quartile (Q3) and the first quartile (Q1).
Can the IQR be negative?
No, the IQR cannot be negative. It is always a non-negative value, as it is calculated as the difference between Q3 and Q1, where Q3 is greater than or equal to Q1.